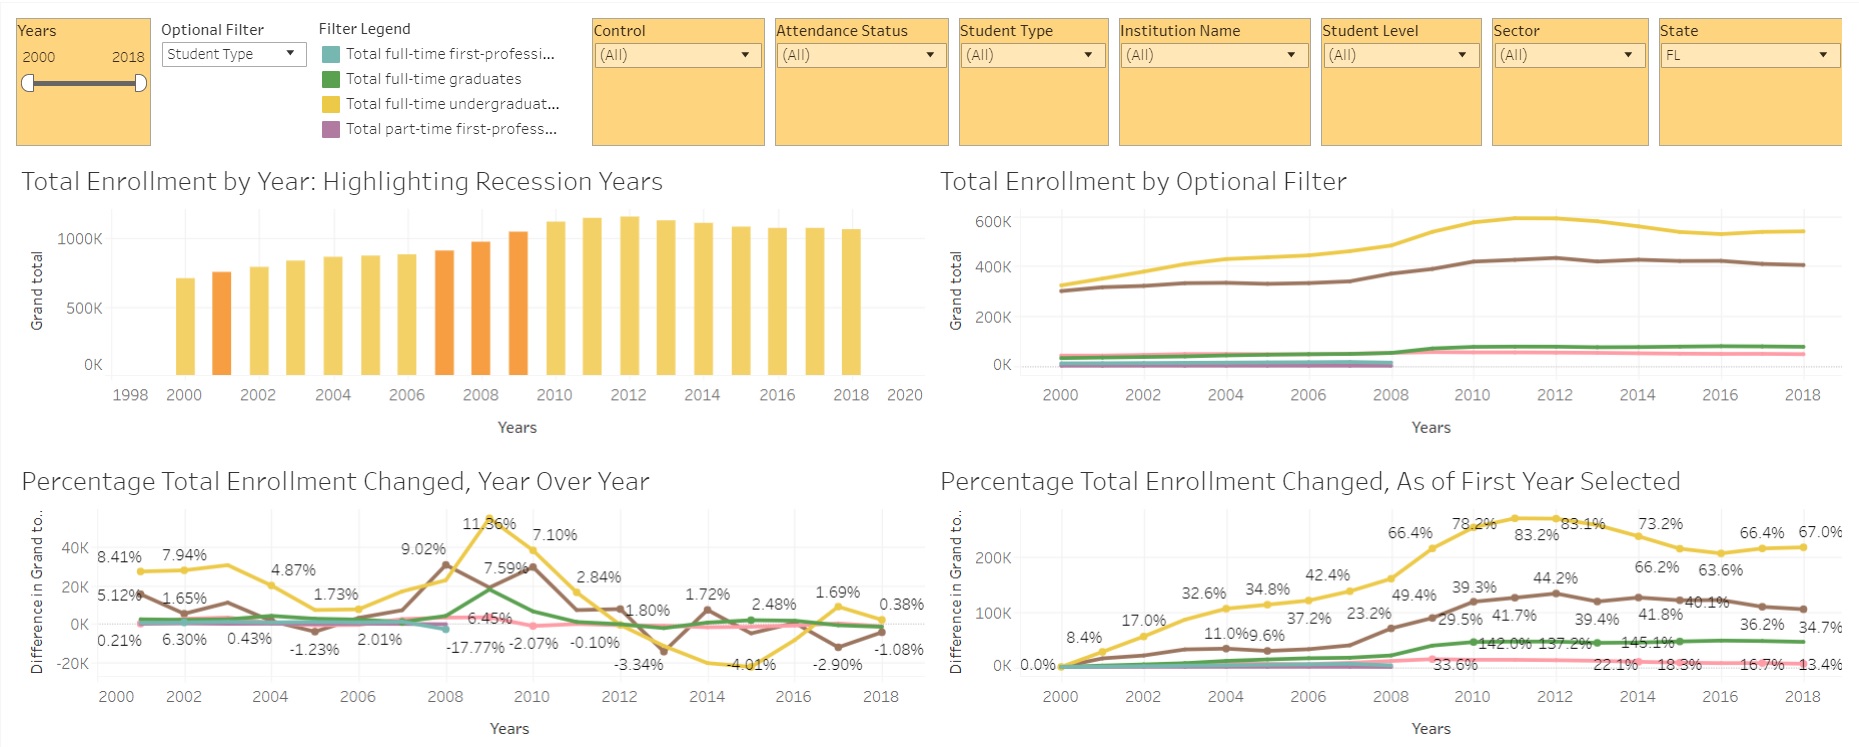
Over the weekend we released our Tableau Software analysis [click here: https://tabsoft.co/3cmwvT8] of US degree-granting institution enrollments for 2000-2018. The Tableau view allows for an analysis of many different higher education attributes.
1. Control: Public, Private, not-for-profit, & Private, for-profit
2. Attendance Status: Full-time & Part-time
3. Sector: Control plus 2-year & 4-year attributes
4. Student Level: Undergraduate, Graduate & First Professional [Note: to see all graduate enrollments click Graduate and First Professional as IPEDS stopped reporting First Professional in 2008]
5. Student Type: Attendance Status plus Student Level; i.e Full-time Graduates and Part-time Graduates
All of these can be also viewed for select institutions or by States.
Please let us know your thoughts and if you have any questions about the data or the analysis. Please note that all Fall Enrollment data was downloaded from the IPEDS data site and all years, except 2018, utilized the most current revised data file. https://tabsoft.co/3cmwvT8
[…] Since fall 2000, enrollments at public, 2-year institutions have declined 9%, from 6,126,361 students to 5,548,642 students, for a total decline of 546,503 students. At the height of the last recession, in fall 2010, there were 1,153,856 more students enrolled at public, 2-year institutions over fall 2000. This peak in enrollment reflects an increase of 18.9% from fall 2000 but a decline of 23.5% since fall 2010. Public, 4-year and private, not-for-profit, 4-year institutions have all gained enrollment since fall 2010, 13.2% and 6.3% respectively. The question remains, if public, 2-year institutions that have become public, 4-year institutions were still reflected as the former in enrollment reports, would the decline at the public, 2-year sector be as steep? That is what we will try to answer next. […]