
The following is a re-post of an article we shared in fall 2014. We are currently updating this research to reflect fall 2017 but thought, as the end of 2019 is here, it would be appropriate to post again before our updated report is available.
Fall 2014 IPEDS Student Demographic Snapshot
The research on who is enrolling in distance education courses is very limiting. In an article by Colorado and Eberle (2010) the researchers discussed the impact of select demographics on student success at a midwestern university. The Learning House has also presented online student profiles with some demographic data, which has been obtained through nationwide surveys for the past several years. Outside of specific institutional data there is very limited information on the demographics of students who are enrolling exclusively in distance education. This report attempts to answer some of the demographic question by analyzing institutional data from wholly online institutions.
As with our other reports, we are utilizing data from the National Center for Educational Statistics’ Integrated Postsecondary Education Data System (IPEDS). The data file for this report comes from the IPEDS data set for fall 2014. IPEDS has identified two categories for distance education enrollment; students who were enrolled “exclusively in distance education” and students who took “some but not all distance education courses”. For comparison purposes this report will evaluate the gender and race/ethnicity for all students enrolled in fall 2014 as well as those students who were enrolled exclusively in distance education.
In fall 2014 there were 20.5 million students enrolled in 4,696 degree granting institutions across the United States. The data files from IPEDS allow us to ascertain how many students were enrolled in undergraduate and graduate programs, how many were full-time and part-time, how many were male and female, and how many were African-American, Hispanic, and Caucasian. By combining these data sets we are also able to break these numbers out by institutional sector, i.e. private and public.
Overall Enrollments Demographics
Table 1 reflects the 20.5 million students enrolled full-time (FT) or part-time (PT) by undergraduate (UG) or graduate (GR) status and by gender. Female students (11,575,067, 56%) represent a larger portion of degree granting institution enrollments, compared to males (8,935,407, 45%). Female enrollments in part-time graduate courses reflect the largest gap between males and females, 38% to 62% respectively.

It is clear from Table 1 that female students comprise the majority of enrollments at degree granting institutions. This trend is also reflected in the breakdown by institution sectors in Table 2. There are no sectors that have greater than 47% male enrollment, undergraduate or graduate. Part-time enrollments by females, however, reach as high as 75% in the private for-profit, 2-year sector. In three of the sectors, private not-for-profit 2-year, private for-profit 2-year, and private for-profit 4-year, female enrollment is above 61% in all enrollment statuses, undergraduate and graduate, as applicable to the sector.

The other demographic identifier available in IPEDS is race and ethnicity. IPEDS utilizes Black, Hispanic and White as reporting categories within the IPEDS data set. For this report Black will be designated as African-American and White will be designated as Caucasian. These three demographic identifiers comprise 81% of the race/ethnic makeup of the 20.5 million students enrolled at degree granting institutions: African-American (2,629,624, 13%), Hispanic (3,277,162, 16%) and Caucasian (10,621,881, 52%). Table 3 reflects the number of students that comprise each race/ethnic makeup by gender for full-time, part-time, undergraduate and graduate enrollment status. The percentages are based on the total male and female enrollments for each enrollment category as reflected in Table 1. For example, there were 4.9 million males enrolled as FT UG students and 11% of those males were African-American.

An important note from Table 3 is that while Hispanic students represent 16% of all enrollments at degree granting institutions, the majority of these enrollments occur at the undergraduate level (17%). At the graduate level, Hispanics comprise 8% of the enrollments while African-Americans and Caucasians comprise 11% and 51% respectively.
In Table 4 we can further breakdown the analysis of male and female enrollments by race/ethnicity and sector. The percentages in this table reflect the total enrollment of the gender by each sector.

Hispanic males and females have a greater percentage of enrollments at 2-year sector institutions, whether private or public. African-American males and females have a greater percentage of enrollment in private not-for-profit 2 year, private for-profit 2-year and 4-year. Caucasian students are similar across all sectors except private for-profit 2 and 4-year year institutions, where they only comprise low to upper thirties percentages compared to other sectors.
Distance Education Demographics
Of the 20.5 million students enrolled in fall 2014, 5.8 million (28%) were enrolled in some form of distance education, either wholly or partially. While we know the student counts, the distribution of students across institutions, and the number of students enrolled by undergraduate or graduate programs, we do not know the race/ethnicity and gender of all students enrolled in distance education courses. By combining IPEDS data sets we are able to gain some insight into these students by analyzing the institutions that enrolled 100% of their students exclusively in distance education.
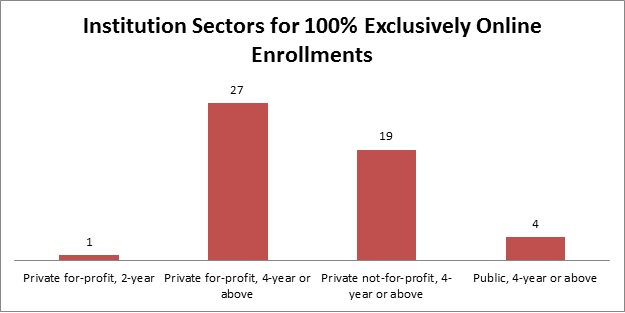
There were 44 institutions in IPEDS that self-identified that all of their programs were offered completely via distance education. Through an analysis of enrollments, I also identified another 7 institutions that had 100% of their enrollments offered exclusively in distance education but the institutions did not identify themselves as such. This brings the total to 51 institutions in fall 2014 that enrolled 100% of their students in exclusively distance education courses.
These institutions represented four different sectors with private for-profit 4-year institutions leading the way with 27 institutions, followed by private not-for-profit 4-year institutions with 19. Table 5 reflects the disbursement of institutions across each sector.
In fall 2014, there were 2.9 million (14%) students enrolled exclusively online. The population of students at the 51 identified institutions was 416,631 or 15% of the 2.9 million. The average enrollment at these institutions was 8,169 with 2 being the lowest and 57,821 being the highest.
Female students (247,267, 59%) represent a larger portion of the 100 percent distance education degree granting institution enrollments compared to males (169,364, 41%). The difference between exclusively online enrollments and all enrollments for females is that female students in exclusively online account for nearly a two to one ratio in all categories except part-time UG. Table 6 reflects that more females than males are enrolling in institutions that offer courses exclusively online.

When analyzing enrollments by sector, as reflected in Table 7, one can see that female students comprise larger enrollments in private institutions versus public, in comparison to their male counterparts.

The final analysis to be conducted on exclusively distance education institutions is for race/ethnicity. In fall 2014, 103,744 (25%) African-Americans, 31,214 (7%) Hispanics, and 214,455 (51%) Caucasians were enrolled in the 51 institutions offering 100% exclusively distance education courses. Table 8 reflects the number of students that comprise each race/ethnic makeup by gender for full-time, part-time, undergraduate and graduate enrollment status. The percentages are based on the total male and female enrollments for each enrollment category as reflected in Table 6. For example, there were 45,930 males enrolled as FT UG students and 20% of those males were African-American.

African-American males and females have a much larger percentage of enrollments across all enrollment statuses at 100% exclusively online institutions. While the numbers may be small, it does reflect that African-American students are enrolling at a higher pace than Hispanic students in distance education. In Table 9 we further breakdown the analysis of male and female enrollments by race/ethnicity and sector. The percentages in this table reflect the total of enrollment of the gender by each sector. Of the 167,163 females enrolled in private for-profit 4-year institution distance education courses, 56,414 (34%) of them were African-American.

Enrollment in private institutions by African-American students is more evident in the 100% exclusively distance education institutions than in the overall enrollments distribution outlined in tables 1 through 4. African-American males and females had a higher percentage of enrollments at private institutions than public, where their enrollments are represented by single digit percentages. As was the case in earlier analyses, Hispanic males and females had higher percentage enrollments in private for-profit 2-year institutions than any other represented sector. Caucasian males and females were distributed across all represented sectors but had higher proportional enrollments at public 4-year institutions compared to African-Americans and Hispanics.
Summary
This research provides some glimpse into who is enrolling in exclusively online courses at degree granting institutions. Through the analysis of 51 institutions, enrolling 416,631 students in exclusively online courses we are able to more fully understand the race/ethnic makeup and gender of these students. In addition, we have insight into the enrollment patterns of these students, as well as the sectors in which they are enrolling.
Research Highlights
- Hispanic students comprise 16% of overall enrollments but only 7% in exclusively online
- Hispanic students have greater enrollments at the undergraduate level than graduate
- African-American females have high enrollments in online courses at the undergraduate and graduate levels but the majority of these enrollments are at private institutions
- Nearly twice as many African-American females than males are enrolled in graduate courses across all institutions
- Caucasian males and females are the majority enrollees at public 4-year exclusively online institutions
Notes:
IPEDS Definitions
- Distance education course – A course in which the instructional content is delivered exclusively via distance education. Requirements for coming to campus for orientation, testing, or academic support services do not exclude a course from being classified as distance education.
- Distance education – Education that uses one or more technologies to deliver instruction to students who are separated from the instructor and to support regular and substantive interaction between the students and the instructor synchronously or asynchronously.
- Technologies used for instruction may include the following: Internet; one-way and two-way transmissions through open broadcasts, closed circuit, cable, microwave, broadband lines, fiber optics, satellite or wireless communication devices; audio conferencing; and video cassette, DVDs, and CD-ROMs, if the cassette, DVDs, and CD-ROMs are used in a course in conjunction with the technologies listed above.