
The National Center for Education Statistics (NCES) (NCES.ed.gov) distributed the The Condition of Education 2020 in May 2020. This particular report is a congressionally mandated annual report summarizing the latest data from NCES and other sources on education in the United States. Of particular interest to CDER in this report is the reflection of for-profit enrollments, particularly since fall 2000.
We have released our own Tableau files covering enrollment of all sectors in U.S. higher education from fall 2000 to fall 2018. In our earlier reports, we reflected that enrollments at degree-granting public, 2-year and private for-profit, 4-year institutions have been declining since 2010. While enrollments at public, 4-year and private not-for-profit, 4-year have increased since 2010. The NCES has also reflected on these trends at the undergraduate level
Between fall 2000 and fall 2018, undergraduate enrollment increased by 83 percent (from 403,000 to 739,000 students) at private for-profit institutions, compared with increases of 27 percent (from 2.2 million to 2.8 million students) at private nonprofit institutions and 24 percent (from 10.5 million to 13.0 million students) at public institutions. Between 2000 and 2010, enrollment in private for-profit institutions increased by 329 percent (from 403,000 to 1.7 million students). In comparison, enrollment increased by 30 percent at public institutions (from 10.5 million to 13.7 million students) and by 20 percent at private nonprofit institutions (from 2.2 million to 2.7 million students) during this period. Enrollment in private for-profit institutions peaked in 2010 and then decreased by 57 percent (from 1.7 million to 739,000 students) between 2010 and 2018. During this period, enrollment in public institutions decreased by 5 percent (from 13.7 million to 13.0 million students), whereas enrollment in private nonprofit institutions increased by 6 percent (from 2.7 million to 2.8 million students).3
and at the graduate (postbaccalaureate) level
From fall 2000 to fall 2018, postbaccalaureate enrollment had a larger percentage increase at private for-profit institutions (415 percent, from 47,200 to 243,000 students) than at private nonprofit institutions (46 percent, from 896,000 to 1.3 million students) and public institutions (22 percent, from 1.2 million to 1.5 million students). Between 2000 and 2010, postbaccalaureate enrollment increased by 528 percent (from 47,200 to 296,000 students) at private for-profit institutions, compared with increases of 34 percent (from 896,000 to 1.2 million students) at private nonprofit institutions and 19 percent (from 1.2 million to 1.4 million students) at public institutions. More recently, however, between 2010 and 2018, enrollment at private for-profit institutions decreased by 18 percent (from 296,000 to 243,000 students), while enrollment at private nonprofit institutions increased by 9 percent (from 1.2 million to 1.3 million students). Enrollment at public institutions was 3 percent higher in 2018 than in 2010 (1.5 million vs. 1.4 million students).
Our Tableau report reflects similar results that were highlighted above from the NCES. The number of enrollments has grown and declined tremendously in the eighteen-year period for the for-profit sectors. Student headcount is just one component of this growth, there was also a growth and decline in the number of institutions providing education to students. The chart below reflects the number of degree-granting private for-profit institutions that were enrolling students from fall 2000 to fall 2018.
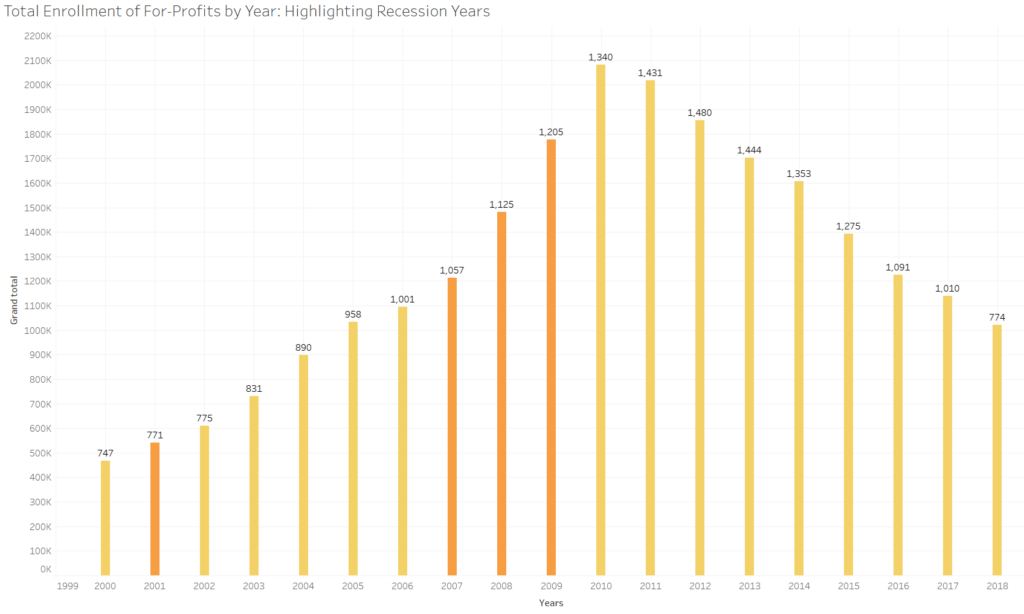
In fall 2000, there were 747 institutions that enrolled 466,611 students. At the start of the recession, fall 2007, there were 1,057 institutions enrolling 1,214,527 students. This was a 160 percent increase in enrollments and a 41 percent increase in the number of institutions. The average enrollment per institution went from 625 in fall 2000, to 1,149 in fall 2007.
During the “recession years”, fall 2007 to fall 2010, the number of enrollments went from 1,214,527 to 2,081,513, an increase of 71 percent. The number of institutions also increased from 1,057 to 1,340, an increase of 27 percent. The average enrollment per institution in fall 2010 was 1,553, an increase of about 400 students each.
In fall 2011, the for-profit sectors started to see a decline in enrollment, from 2,081,513 to 2,017,672, or a decrease of three percent. The number of institutions continued to grow however, from 1,340 to 1,431, an increase of seven percent. The number of for-profit institutions would not be below fall 2010 numbers until fall 2015 when there were 1,275. Enrollments at this point had dropped from 2,017,672 in fall 2011, to 1,394,288, a decrease of 31 percent. The average number of enrollments per institution in fall 2015 was 1,093.
The final three years, fall 2015 to 2018, saw a decline in enrollment of 27 percent, from 1,394,288 to 1,022,508 students. These numbers are like fall 2005, pre-recession, when enrollments were at 1,034,696. The final count of institutions in fall 2018, was 774, 33 more than in fall 2000.
Degree-granting for-profit institutions grew enrollments 346 percent from fall 2000 to fall 2010. This was accomplished by adding 593, 79 percent, more institutions during the same period. Enrollments have declined fifty-one percent from fall 2010 to 2018 but there appears to be a rebound in the works. According to the latest data by the National Student Clearinghouse preliminary enrollment numbers for fall 2020 reflect a three percent growth in undergraduate enrollments and a nine percent growth in graduate enrollments at for-profit institutions over fall 2019. At the CDER, we will wait and see what the fall 2019 enrollment numbers reflect, when they become released by IPEDS, before we draw any conclusions to the for-profit sectors rebounding.